


A new publicly available dataset aims to close a data gap in understanding U.S. disaster losses that current federal government maps often used in policy making are missing.
The Federal Reserve Bank of New York released the Losses from Natural Disasters dataset—an open source, regularly updated record of damages, injuries, and fatalities from natural disasters, with complete county-level coverage from 1996 onward.
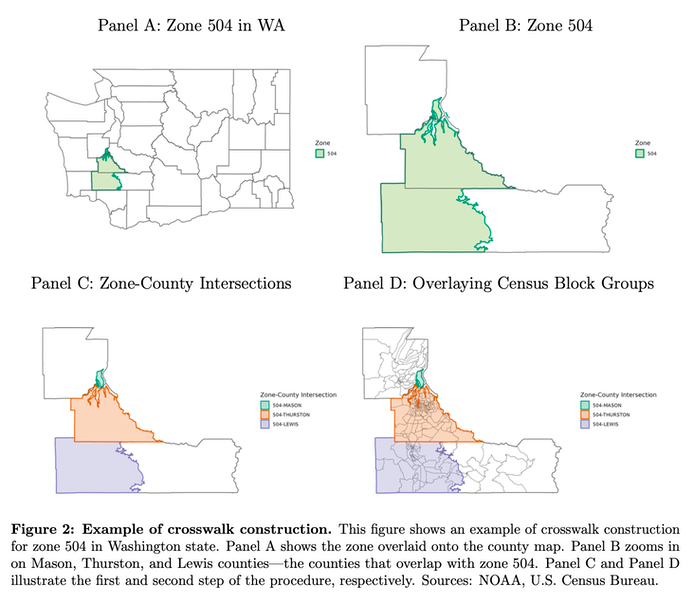
The research, published by the New York Fed earlier this month, addresses a longstanding challenge in disaster risk modeling: The National Oceanic and Atmospheric Administration (NOAA)’s Storm Events Database (SED) historically reported nearly 40% of disaster loss events using “zones” rather than counties.
While zones offer meteorological precision, they complicate financial analysis and modeling that needs county-level administrative data, such as employment, housing stock, or insured asset values.
According to the report, existing commercial products that attempt to bridge this gap often use overly simplistic methods, typically dividing losses evenly across all counties that overlap a given zone.
The New York Fed’s approach attempts to improve on this through a systematic reallocation method. Using historical maps, US Census block group data, and geographic information system (GIS) tools, the Fed’s research team apportioned zone-level damages based on weighted variables like population, housing stock, economic activity, and employment.
This granular approach means financial are offered a choice of weighting schemes depending on the type of analysis they need to perform—whether it’s related to property, casualty risk, or financial exposure tied to population density.
As the report emphasizes, “Our methodology leads to county-level estimates that are particularly accurate for severe disasters,” where traditional equal-weighting schemes tend to produce the largest discrepancies.
The dataset’s implications for catastrophe modeling and insurance underwriting are tangible. The Fed researchers provide examples showing significant differences between their methodology and commercial equal-weighting methods.
For instance, in the case of Zone 504 in Washington state, commercial datasets might split damages equally across three counties, ignoring population or economic activity density. In contrast, the New York Fed’s weights show one county accounting for up to 85% of damages due to factors like housing concentration and urban infrastructure.
This recalibration isn’t just an academic exercise. As the research notes, the severity of natural disasters is highly skewed: A small percentage of events are responsible for the majority of damages, injuries, and fatalities. The study documents that hurricanes, tropical storms, floods, and coastal disasters have grown more severe over the past 25 years, while droughts and wildfires have become comparatively less severe in terms of reported damages.
For insurance and reinsurance firms, this confirms trends already visible in loss experience data, but with an additional layer of spatial detail critical for portfolio management and reinsurance structuring.
For example, the report notes that while droughts, hurricanes, and coastal disasters are rare, they tend to generate the highest per capita damages, with median damages for a county-year hit by a disaster at $4.6 per person, but the 99th percentile reaching over $4,355.
The Losses from Natural Disasters dataset is now live and publicly available through the New York Fed’s website.


